|
|
|
|
|
|
| The Yorba Linda Trend - Recent Seismic History |
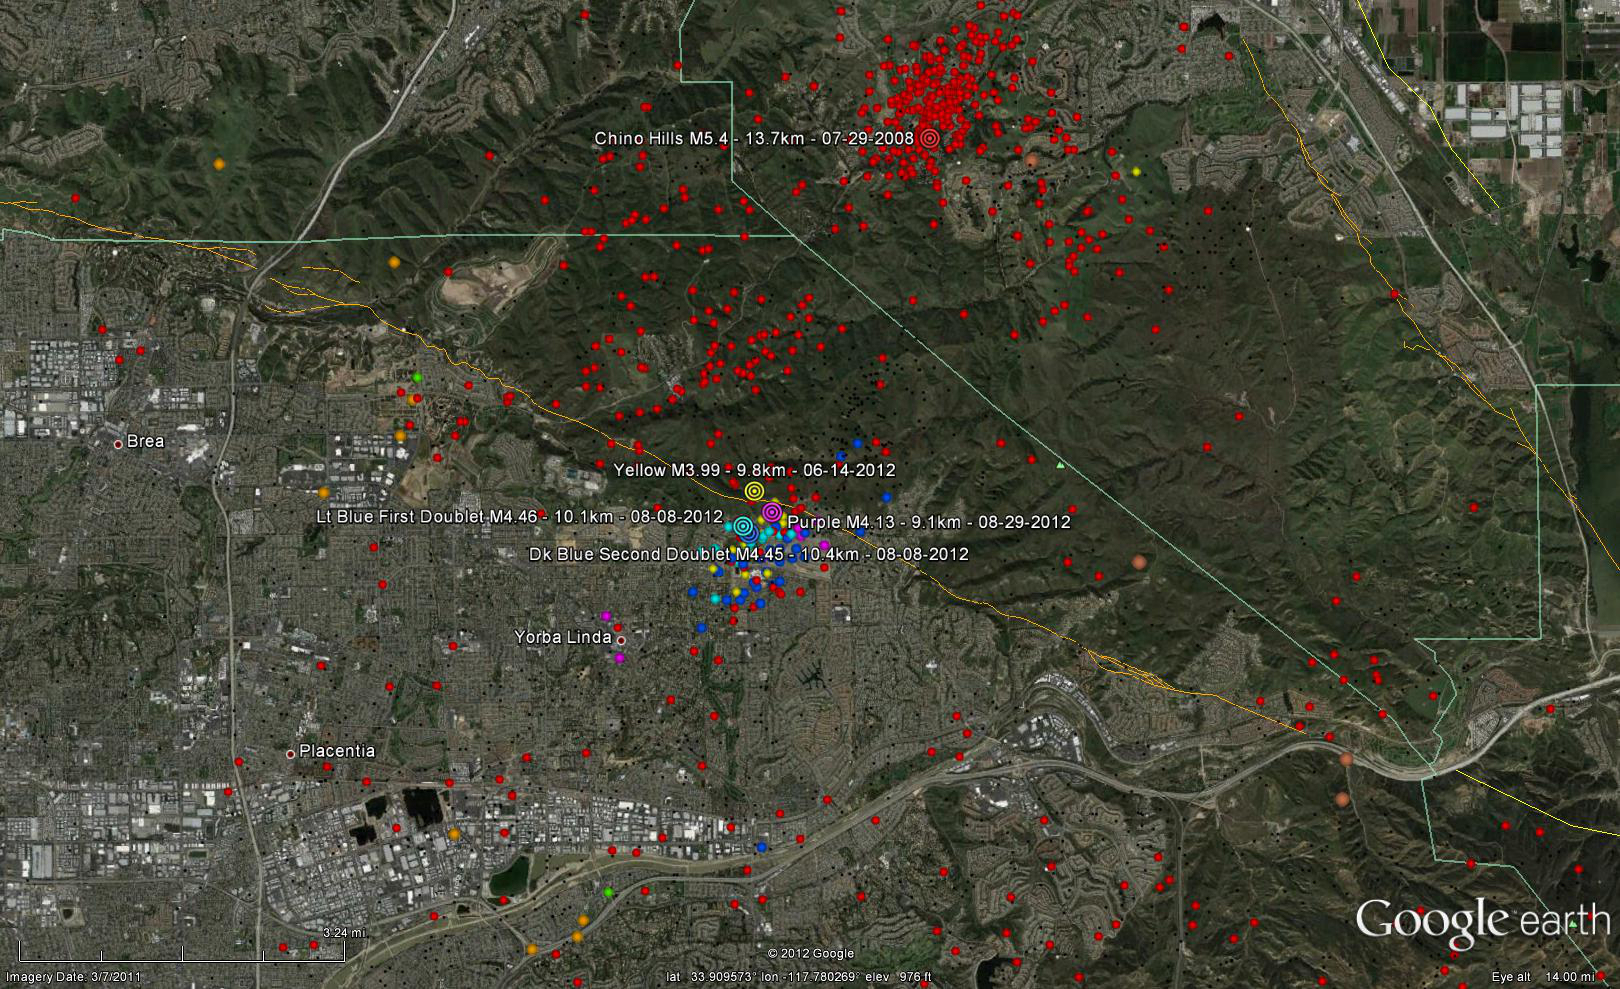
Yes, it's a big image, with lots of dots. I wanted to see how the quakes in the past few years have played out over time. Color progresses through time with oldest as black, then brown, red, orange, yellow, green, lt blue, dk blue, and most recent as purple. Black - There's a lot of little black dots all over the place. This is the background seismicity up to just prior to the 2008 Chino Hills quake. There's certainly a denser area of activity just north-east of the current activity, which may be highlighting the stress of the region. There is also an extra smattering of dots mostly east of the future Chino Hills epicenter, but not as tightly packed as further south-west where the current activity is taking place. Brown - One month prior to Chino Hills. There are only a few quakes. There is one just to the east of the Chino Hills epicenter, half way to the yellow dot. There are also a couple down in the Santa Ana Canyon on the lower right corner of the image, where the 91 freeway passes through. And, one final brown dot between the canyon pair and the future Chino Hills epicenter. All in all, I'd say there was little prior warning of the Chino Hills quake. Could that one little dot to its east be a foreshock? I wouldn't think so since it's not even along the fault plane of the Yorba Linda Trend. Since knowledge of the Yorba Linda trend is so recent, only in hindsight context could we say that perhaps the ABSENCE of activity could mean possible future activity. Red - This is the July 29th, 2008 Chino Hills quake, magnitude 5.4, and all aftershocks for the following years until just prior to the next large quake in the area earlier this year in June. There's the obvious aftershocks right around the epicenter, and to it's east. There's also a pocket of after shocks to the south-west, but north-west of the current activity. This is in the area of Carbon Canyon, which is a popular road for motorcyclists with its numerous tight turns and a couple of hairpin switchbacks. Carbon Canyon also hosts La Vida Mineral Springs which were popular in the 1930's (http://carboncanyonchronicle.blogspot.com/2008/11/la-vida-mineral-springs-history-from.html) Orange - This is the one month prior to the June 14th, 2012 M3.99 quake. The only activity are two groupings, one to the SSW and one looser group to the west, both severl kilometers away from the current activity. Yellow - June 14th, 2012 M3.99 Yorba Linda quake. Not all that strong, so most would dismiss it as "just another quake." The few aftershocks are to the SSW of the epicenter. Green - One month prior to the coming doublet. Note that the only two events in this time block are in the same two groupings in orange denoting the one month period prior to the M3.99. hmmmmmm..... Light Blue - This is the first of the doublets, occurring at 11:23pm on the evening of August 7th, with a local magnitude of 4.45. The aftershock pattern looks to be very tight and possibly aligned east-west. Dark Blue - 10 hours later, at 9:33am on August 8th, the second of the doublets occurred with a local magnitude of 4.46. Note that it's aftershock pattern is much more dispersed, spreading to the east of the epicenter in a north-south pattern. There does seem to be more of them on the south side of the pattern. Of note is the one lone aftershock several kilometers to the south, just north of the 91 freeway, and not far from the group of orange dots (and one green) previously mentioned. Purple - This is the most recent in the series, a 4.13 local magnitude quake occurring at 1:30 in the afternoon on August 29th. It hasn't been very long so the aftershocks haven't had time to accumulate yet, but take note of the pair to the south-west of the main shock cluster. If these don't get relocated, it could mean something since that is trending toward that group of orange dots previously mentioned. What does any of this mean? Obviously we don't really know for sure. But my guess is that the Yorba Linda trend lines up from the China Hills epicenter to the current cluster in Yorba Linda, cuts across the Whittier Fault, and continues into the sedimentary area further south west. The area of those orange dots is part of the Santa Ana River bed (and 91 freeway). The ponds you see are reservoirs used for recharging the Santa Ana aquifer. It's also an industrial are, where I once worked. The 'orange cluster' could be nothing, but it might be a sign of residual stress in the area of the possible continuation of the Yorba Linda Trend I just posited. The quakes themselves could be the ductile sedimentary rocks settling due tot he change in the local stress field. I admit, this is all just WAG on my part. But, I would not be surprised if there were some bigger quakes above background magnitude in that direction in the future. My WAG is nothing bigger than a 4 or so. Brian Follow Ups: ● Re: The Yorba Linda Trend - Recent Seismic History - Island chris 08:09:59 - 8/31/2012 (80253) (1) ● Re: The Yorba Linda Trend - Recent Seismic History - Skywise 12:36:11 - 8/31/2012 (80258) (0) |
|
|
|
|